Topic 4, Misc. Questions
You need to create a relationship in the dataset for RLS.
What should you do? To answer select the appropriate options in the answer area.
NOTE: Each correct selection is worth one point.

You have a query that returns the data shown in the following exhibit.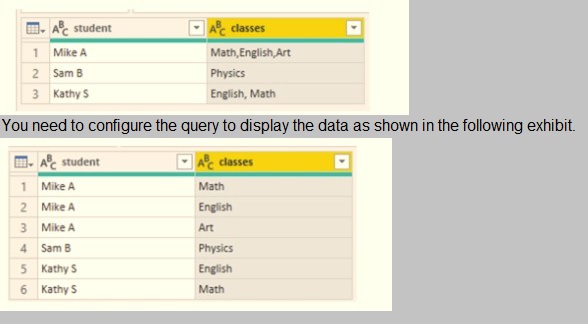
Which step should you use in the query?
A.
=Table.ExpandListColum(Table.TransformColunins(Source, {{"classes".
Splitter.SplitTextByDelimiter('','', QuoteStyle.None), let itemType - (type nullable text) meta
[Serialized.Text = true] in type {itemType}}}), "classes")
B.
= Table.Unpivot(Source, {"classes"}, "Attribute", "Value")
C.
= Table.SplitColumn(Source, "classes". Splitter.SplitTextByDelimiterf",",
QuoteStyle.None), {"classes.1"})
D.
= Table.SplitColumn(Source, "classes". Splitter.SplitTextByPositions({10}), {"classes.1"})
= Table.Unpivot(Source, {"classes"}, "Attribute", "Value")
Explanation:
Power Query Unpivot columns: You might want to unpivot data, sometimes called flattening
the data, to put it in a matrix format so that all similar values are in one column. This is
necessary, for example, to create a chart or a report.
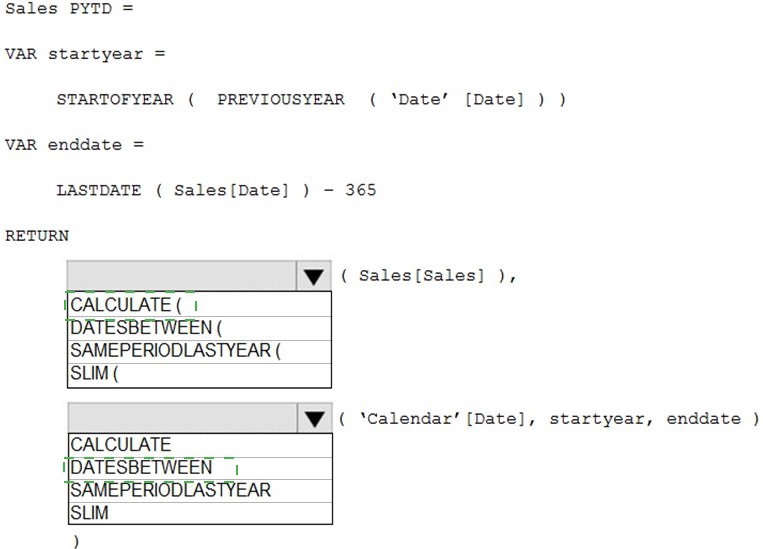
You are enhancing a Power BI model that has DAX calculations.
You need to create a measure that returns the year-to-date total sales from the same date of the previous calendar year.
Which DAX functions should you use? To answer, select the appropriate options in the answer area.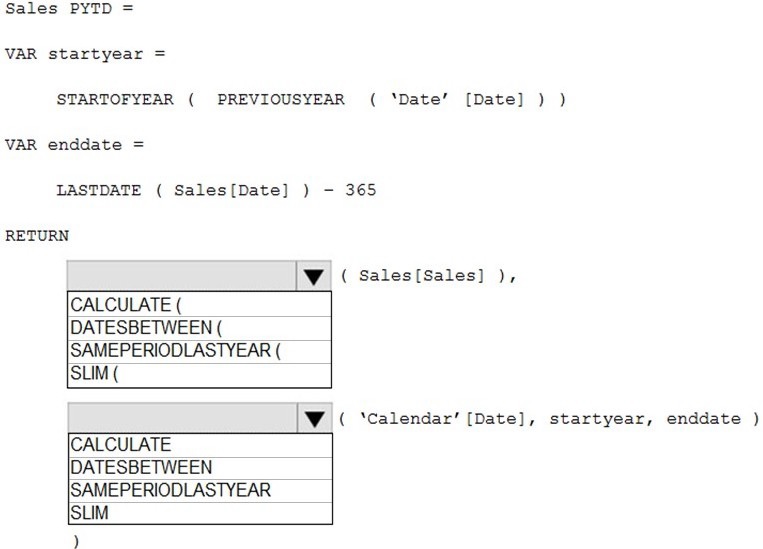
You are developing a report page. Some users will navigate the report by using a keyboard, and some users will consume the report by using a screen reader. You need to
ensure that the users can consume the content on a report page in a logical order. What
should you configure in Microsoft Power Bl Desktop?
A.
the bookmark order
B.
the layer order
C.
the tab order
D.
the X position
the tab order
Explanation:
If you find yourself unable to navigate to an object or visual while using a keyboard, it may
be because the report author has decided to hide that object from the tab order. Report
authors commonly hide decorative objects from the tab order. If you find that you cannot
tab through a report in a logical manner, you should contact the report author. Report
authors can set the tab order for objects and visuals.
Reference:
https://docs.microsoft.com/en-us/power-bi/create-reports/desktop-accessibility-consumingtools
Note: This question is part of a series of questions that present the same scenario. Each
question in the series contains a unique solution that might meet the stated goals. Some
question sets might have more than one correct solution, while others might not have a
correct solution.
After you answer a question in this section, you will NOT be able to return to it. As a result,
these questions will not appear in the review screen.
You have a Microsoft Excel workbook that is saved to Microsoft SharePoint Online. The
workbook contains several Power View sheets.
You need to recreate the Power View sheets as reports in the Power Bl service.
Solution: From the Power Bl service, get the data from SharePoint Online, and then click
Connect
Does this meet the goal?
A.
Yes
B.
No
No
Explanation:
We need to click "Import", not "Connect".
References:
https://docs.microsoft.com/en-us/power-bi/service-excel-workbook-files
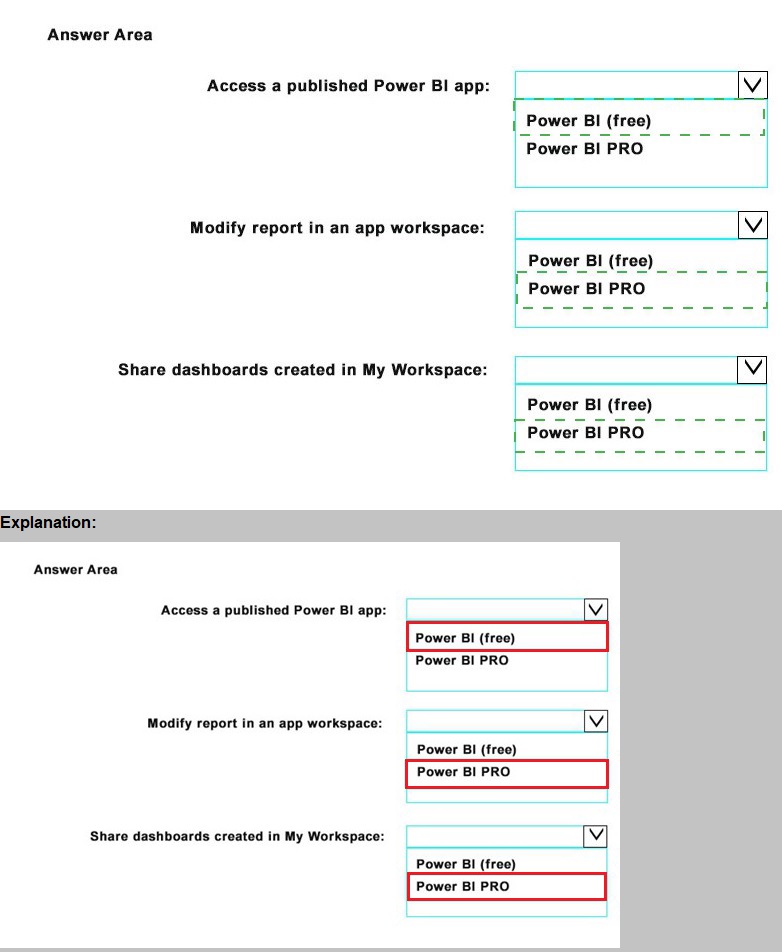
Your company plans to use Power BI for 20 users in the sales department. The users will
perform the following tasks:
Access a published Power BI app
Modify reports in an app workspace
Share dashboards created in My Workspace
You need to identify which Power BI licenses are required for the tasks. The solution must
use the Power BI (free) licenses, whenever possible.
Which license should you identify for each task? To answer, select the appropriate options
in the answer area.
NOTE: Each correct selection is worth one point.
You are creating a Microsoft Power Bl imported data model to perform basket analysis. The
goal of the analysis is to identify which products are usually bought together in the same
transaction across and within sales territories.
You import a fact table named Sales as shown in the exhibit. (Click the Exhibit tab.)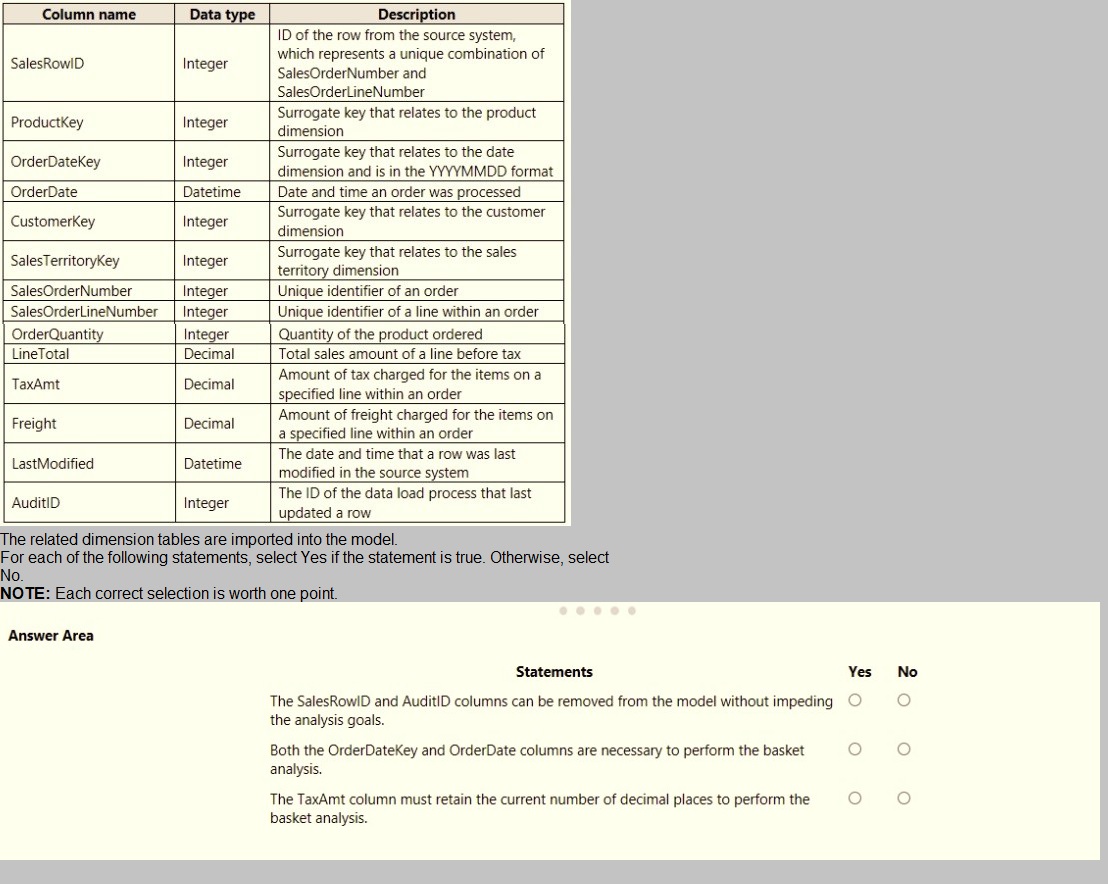

You are building a Power BI report to analyze customer segments.
You need to identify customer segments dynamically based on the Bounce Rate across
dimensions such as source, geography, and demographics. The solution must minimize
analysis effort.
Which type of visualization should you use?
A.
decomposition tree
B.
funnel chart
C.
Q&A
D.
key influencers
key influencers
Explanation:
The key influencers visual is a great choice if you want to:
See which factors affect the metric being analyzed.
Contrast the relative importance of these factors. For example, do short-term contracts
affect churn more than long-term contracts?
Note: The key influencers visual helps you understand the factors that drive a metric you're
interested in. It analyzes your data, ranks the factors that matter, and displays them as key
influencers. For example, suppose you want to figure out what influences employee
turnover, which is also known as churn. One factor might be employment contract length,
and another factor might be commute time.
https://docs.microsoft.com/en-us/power-bi/visuals/power-bi-visualization-influencers
You have a CSV file that contains user complaints. The file contains a column named
Logged. Logged
contains the date and time each compliant occurred. The data in Logged is in the following
format: 2018-12-31 at 08:59.
You need to be able to analyze the complaints by the logged date and use a built-in date
hierarchy.
D18912E1457D5D1DDCBD40AB3BF70D5D
What should you do?
A.
Change the data type of the Logged column to Date.
B.
Apply a transform to extract the last 11 characters of the Logged column and set the data type of the new column to Date.
C.
Create a column by example that starts with 2018-12-31 and set the data type of the new column to Date.
D.
Apply a transform to extract the first 11 characters of the Logged column
Create a column by example that starts with 2018-12-31 and set the data type of the new column to Date.
In Power Bi Desktop, you are creating visualizations in a report based on an imported
dataset
You need to allow Power Bi users to export the summarized data used to create the
visualizations but prevent the users from exporting the underlying data
What should you do?
A.
From Power BI Desktop, configure the Data Load settings for the current file.
B.
From the Power BI service, configure the dataset permissions.
C.
From Power BI Desktop, configure the Report settings for the current file.
D.
From Power BI Desktop, modify the data source permissions.
From the Power BI service, configure the dataset permissions.
Note: This question is part of a series of questions that use the same scenario. For
your convenience, the scenario is repeated in each question. Each question
presents a different goal and answer choices, but the text of the scenario is the
same in each question in this series.
You have a Microsoft SQL Server database that contains the following tables.
The following columns contain date information:
- Date[Month] in the mmyyyy format
- Date[Date_ID] in the ddmmyyyy format
- Date[Date_name] in the mm/dd/yyyy format
- Monthly_returns[Month_ID] in the mmyyyy format
The Order table contains more than one million rows.
The Store table has a relationship to the Monthly_returns table on the Store_ID column.
This is the only relationship between the tables.
You plan to use Power BI Desktop to create an analytics solution for the data.
You need to create a relationship between the Monthly_returns table and Date[Date_ID].
What should you do before you create the relationship?
A.
In the Date table, create a new calculated column named MonthJD that uses the yyyydd format.
B.
In the Monthly_returns table, create a new calculated column named DateJD that uses the ddmmyyyy format.
C.
To the Order table, add a calculated column that uses the
RELATED(Monthly_returns[Month_ID]) DAX formula.
D.
To the Date table, add a calculated column that uses the RE LATE D(Monthly_ret urns
[MonthJD]) DAX formula.
In the Monthly_returns table, create a new calculated column named DateJD that uses the ddmmyyyy format.
Explanation:
References:
https://docs.microsoft.com/en-us/power-bi/desktop-create-and-manage-relationships
Note: This question is part of a series of questions that present the same scenario.
Each question in the series contains a unique solution that might meet the stated
goals. Some question sets might have more than one correct solution, while others
might not have a correct solution.
After you answer a question in this section, you will NOT be able to return to it. As a
result, these questions will not appear in the review screen.
You create a parameter named DataSourceExcel that holds the file name and location of a
Microsoft Excel data source.
You need to update the query to reference the parameter instead of multiple hard-coded
copies of the location within each query definition.
Solution: You modify the source step of the queries to use DataSourceExcel as the file
path.
Does this meet the goal?
A.
Yes
B.
No
Yes
Explanation:
Parameterising a Data Source could be used in many different use cases. From connecting
to different data sources defined in Query Parameters to load different combinations of
columns.
Reference:
https://www.biinsight.com/power-bi-desktop-query-parameters-part-1/
| Page 4 out of 25 Pages |
| Previous |