Your client would like to create a new harmonization field - Exam Topic.
The below table represents the harmonization logic from each source.
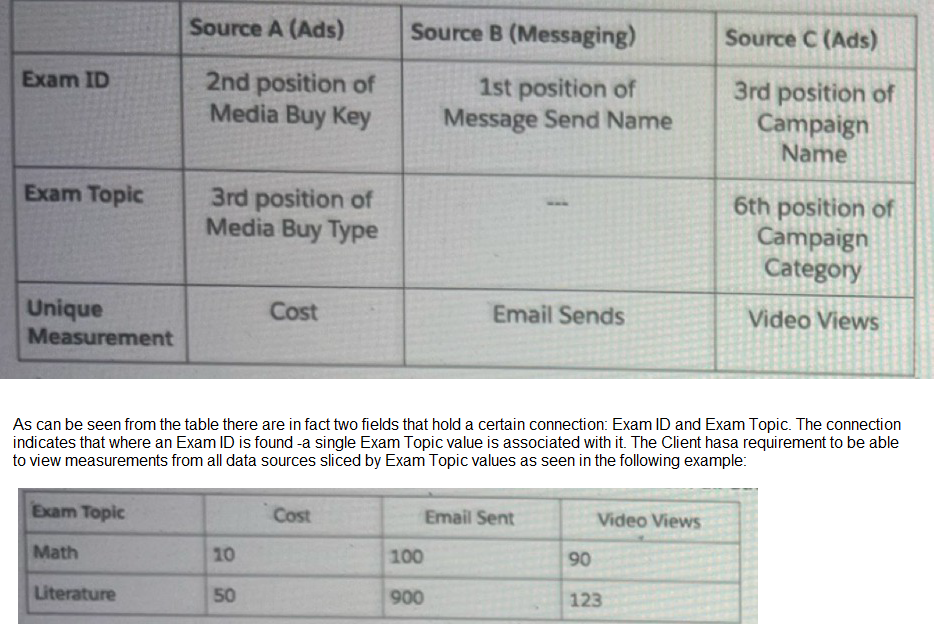
Which harmonization feature should an Implementation engineer use to meet the client's requirement?
A. Transformers
B. Parent Chile
C. Fusion
D. Custom Classification
E. Calculated dimensions
Explanation: To meet the client's requirement of slicing measurements by 'Exam Topic' values, an Implementation Engineer should use Custom Classification. This feature allows different Exam IDs to be classified into their respective Exam Topics, ensuring that data from all sources can be accurately harmonized and analyzed based on these topics.
Which two statements are correct regarding variable Dimensions in marketing Cloud intelligence’s data model?
A. These dimensions are stored at the workspace level
B. Variable Dimensions hold a Many-to-Many relationship with its main entity
C. All variables exist in every data set type, hence are considered as overarching dimensions
D. These are stand alone dimensions that pertain to the data set itself rather than to a specific entity
Explanation: Variable dimensions in Marketing Cloud Intelligence's data model are flexible and can be associated with multiple entities, forming a many-to-many relationship. These dimensions are configured and stored at the workspace level, allowing for customization and alignment with specific reporting needs and analytics practices.
An Implementation engineer is requested to create anew harmonization field 'Offer’and apply the following logic:
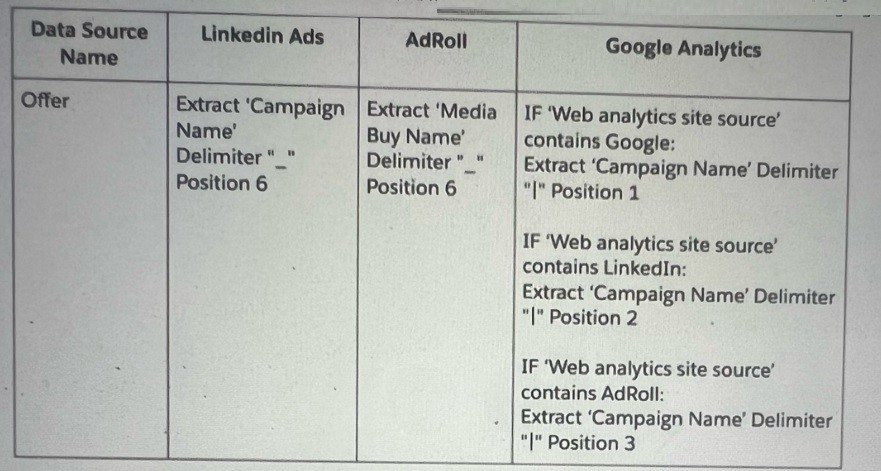
The implementation engineer to use the Harmonization Center. Which of the below actions can help implement the new dimension ‘Offer?
A. Two separate patterns (filtered by Linkedin or AdRoll sources) Within Google Analytics' mapping A formula that reflects the logic above will be populated within a Web Analytics Site custom attribute Another pattern to be created for the newly Web Analytics Site custom attribute (filtered by Google Analytics source). A total of 3 patterns.
B. Two separate patterns (filtered by Linkedin or AdRoll sources) Within Google Analytics' mapping: A formula that reflects the logic above will be populated within a Campaign custom attribute. Another pattern to be created for the newly campaign attribute (filtered by Google Analytics source). A total of 3 patterns
C. Two separate patterns (filtered by Linkedin or AdRoll sources). Another single pattern for Campaign Name (filtered by Google Analytics source). A total of 3 patterns.
D. Two separate patterns (filtered by Linkedln or AdRoll sources). Another single pattern for Web Analytics Site Source (filtered by Google Analytics source), extracting all three positions A total of 3 patterns.
Explanation: To implement the new harmonization field 'Offer', the implementation engineer would create two separate harmonization patterns for LinkedIn and AdRoll sources, extracting the 'Campaign Name' using the specified delimiter and position. Then, within Google Analytics' mapping, a custom attribute for the 'Campaign' would be created to apply the formula logic based on the source. This allows for the harmonization of campaign data across different platforms, ensuring consistency in the reporting and analysis within Marketing Cloud Intelligence. The total patterns required would be three, one for each data source involved.
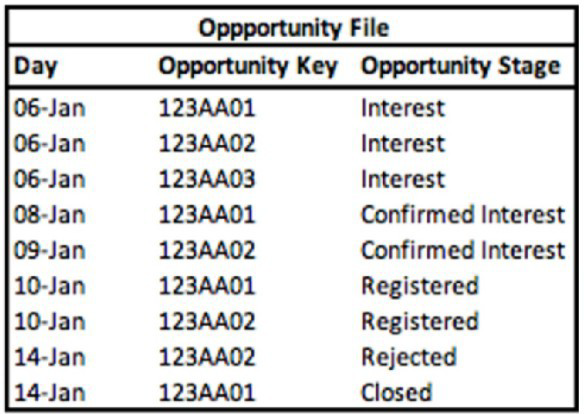
A technical architect is provided with the logic and Opportunity file shown below:
The opportunity status logic is as follows:
For the opportunity stages “Interest”, “Confirmed Interest” and “Registered”, the status should be “Open”.
For the opportunity stage “Closed”, the opportunity status should be closed Otherwise, return null for the opportunity status.
Given the above file and logic and assuming that the file is mapped in a generic data stream type with the following mapping
“Day” — Standard “Day” field
“Opportunity Key” > Main Generic Entity Key
“Opportunity Stage” + Generic Entity Key 2
A pivot table was created to present the count of opportunities in each stage. The pivot table is filtered on Jan 7th - 11th. Which option reflects the stage(s) the Opportunity key 123AA01 is associated with?
A. Registered
B. Interest & Registered
C. Confirmed Interest & Registered
D. Interest
E. Confirmed Interest
Explanation: Analyzing the Opportunity file with a filter set from January 7th to 11th, Opportunity Key '123AA01' appears under 'Interest' on January 6th and 8th, and under 'Registered' on January 10th. Therefore, during the specified date range, Opportunity Key '123AA01' is associated with both 'Interest' and 'Registered' stages. Salesforce Marketing Cloud Intelligence provides the capability to map and track opportunity stages over time, allowing for historical stage tracking and reporting. This answer aligns with the ability to use pivot tables to filter and display data by specific attributes and timeframes, as outlined in the Salesforce Marketing Cloud Intelligence documentation.
Which three entities and/or functions can be used in an expression when building a calculated dimension?
A. The VLOOKUP function
B. Mapped dimensions
C. The EXTRACT function
D. Calculated dimensions
E. Mapped measurements
Explanation: In the context of Marketing Cloud Intelligence, when building a calculated dimension, you can typically use:
B. Mapped dimensions: These are dimensions that have been brought into Marketing Cloud Intelligence through the data integration process and have been mapped to a known schema or model.
C. The EXTRACT function: This function can be used to dynamically create dimensions by extracting values from a mapped dimension or measurement.
E. Mapped measurements: Similar to mapped dimensions, these are quantitative data points that have been integrated into the platform and can be referenced in calculations.
Calculated dimensions (D) and the VLOOKUP function (A) are not typically used within the expression for a calculated dimension. Calculated dimensions are usually an output, not an input, and VLOOKUP is a function typically used to enrich or connect data, not within the definition of a calculated dimension itself.
What are unstable measurements?
A. Measurements for which Aggregation Settings are set as ‘Auto’ and Granularity is set as ‘None’.
B. Measurements that are set with the LIFETIME aggregation function
C. Measurements for which Aggregation Settings are set as ‘Not Auto’ and Granularity is set as ‘None’.
D. Measurements for which Aggregation Settings are set as ‘Not Auto’ and Granularity is set as ‘Not Empty’.
Explanation: Unstable measurements refer to metrics that are not aggregated in a standard manner across different grains of data, which can result in inconsistent or unpredictable results when reporting across different dimensions or time frames.
Option C describes a scenario where measurements have manual (Not Auto) aggregation settings, meaning they do not automatically adjust to the aggregation level of the report. Combined with a Granularity setting of 'None', this can lead to instability because the metric isn't bound to a specific granularity, which can cause data inconsistencies or misinterpretations when analyzed at varying levels of detail.
A client wants to integrate their data within Marketing Cloud Intelligence to optimize their marketing Insights and cross-channel marketing activity analysis. Below are details regarding the different data sources and the number of data streams required for each source.
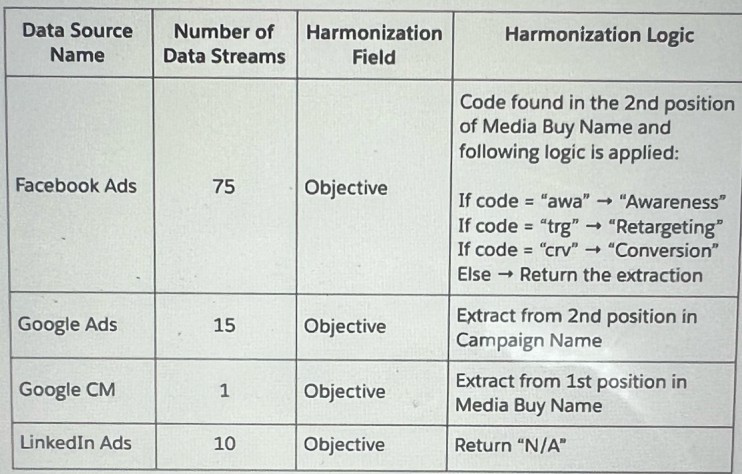
Which three advantages does a client gain from using Calculated Dimensions as the harmonization method for creating the Objective field?
A. Scalability - future data streams that will follow similar logic will be automatically harmonized.
B. Data model restrictions - Calculated Dimensions do not need to adhere to Marketing Cloud Intelligence's data model
C. Processing - creation of Calculated Dimensions will ease the processing time of the data streams it relates to
D. Ease of Maintenance - the logic is written and populated in one centralized place
E. Performance (Performance when loading a dashboard page) should be optimized as the values of calculated dimensions are stored within the database.
Explanation: Scalability: Using Calculated Dimensions allows the client to apply the same harmonization logic to future data streams, ensuring consistency and reducing the need for individual adjustments.
Ease of Maintenance: With the logic centralized in Calculated Dimensions, any adjustments or updates are applied in one place, simplifying ongoing management.
Performance: Calculated Dimensions can improve dashboard performance because their values are pre-computed and stored, reducing the need for real-time calculations when loading dashboards.
A client's data consists of three data streams as follows:
Data Stream A:
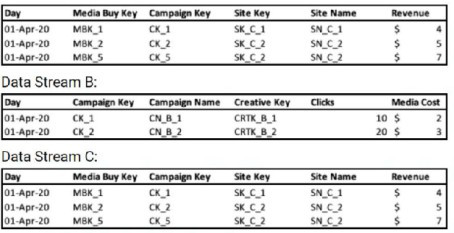
* The data streams should be linked together through a parent-child relationship.
* Out of the three data streams, Data Stream C is considered the source of truth for both the dimensions and measurements.
How should the "Override Media Buy Hierarchies” checkbox be set in order to meet the client's requirements?
A. It should be checked in Data Stream C
B. It should not be checked in any of the three Data Streams.
C. It should be checked in Data Stream B
D. It should be checked in Data Stream A
Explanation: If Data Stream C is the source of truth, the "Override Media Buy Hierarchies" checkbox should be checked for Data Stream C. This means that the hierarchy defined within Data Stream C will take precedence over any other media buy hierarchies present in Data Streams A or B. By doing so, it enforces that the hierarchy from the source of truth (Data Stream C) is used throughout the dataset, maintaining the integrity of the hierarchical relationships as defined by the most reliable data source.
A client's data consists of three data streams as follows:
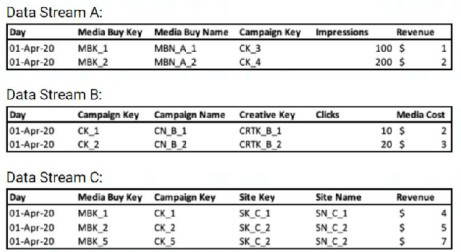
* The data streams should be linked together through a parent-child relationship.
* Out of the three data streams, Data Stream C is considered the source of truth for both the dimensions and measurements.
* Data Stream C was set as a ‘Parent’, and the ‘Override Media Buy Hierarchy’ checkbox is checked
What should the Data Updates Permissions be set to for Data Stream B?
A. There is no difference, all permissions will have a similar effect given the scenario.
B. Update Attributes and Hierarchies
C. Update Attributes
D. Inherit Attributes and Hierarchies
Explanation: With Data Stream C set as the 'Parent' and 'Override Media Buy Hierarchy' checked:
The appropriate setting for Data Stream B would be 'Update Attributes and Hierarchies'. This setting will ensure that the hierarchy and attributes from the parent data stream (C) are updated based on the child data stream (B) without overwriting the measurement data that the parent is the source of truth for.
The 'Override Media Buy Hierarchy' option checked indicates that the hierarchy of the parent is to be considered as the main one, but the attributes and hierarchy can still be updated from the child data stream, which aligns with option B.
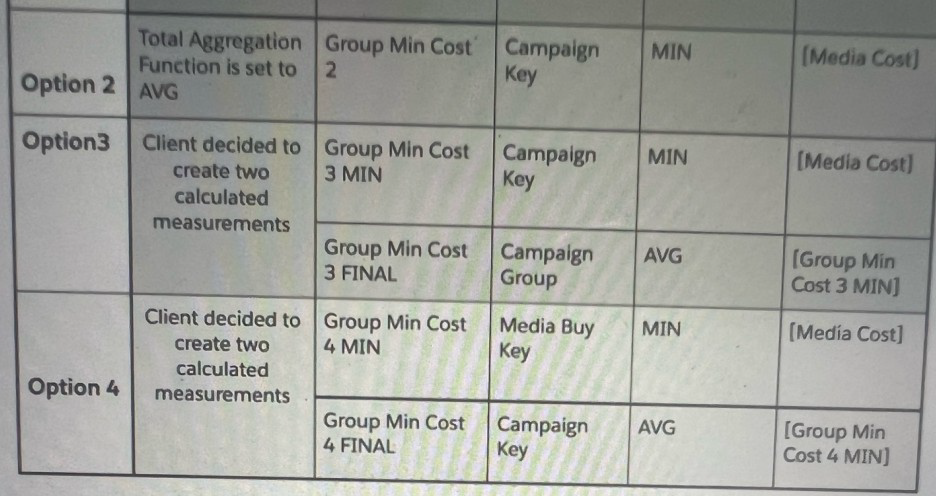
Which option will yield the desired result:?
A. Option 1
B. Option 4
C. Option 2
D. Option 3
Explanation: Option 4 presents two calculated measurements for 'Group Min Cost' with 'MIN' and 'AVG' aggregations. This approach aligns with the client's need for the minimum and average media cost values. 'Group Min Cost 4 MIN' will calculate the minimum media cost across the 'Media Buy Key', while 'Group Min Cost 4 FINAL' will average these minimum costs at the 'CampaignKey' level. This will yield the desired result where minimum costs are calculated at the Media Buy Key level and then averaged at the Campaign Key level.
After uploading a standard file into Marketing Cloud intelligence via total Connect, you noticed that the number of rows uploaded (to the specific data stream) is NOT equal to the number of rows present in the source file. What are two resource that may cause this gap?
A. All mapped Measurements for a given row have values equal to zero
B. Main entity is not mapped
C. The source file does not contain the mediaBuy entity
D. The file does not contain any measurements (dimension only)
Explanation: In Marketing Cloud Intelligence, discrepancies between the number of rows uploaded and the number of rows present in the source file can be caused by several factors. If all mapped measurements for a row are zero, that row may be excluded from the upload, as it does not contribute to the analytics. Additionally, if the main entity, which acts as the primary identifier for records, is not mapped, the system cannot correctly ingest the data as it lacks the necessary reference to organize and store the information.
A client Ingested the following We into Marketing Cloud Intelligence:
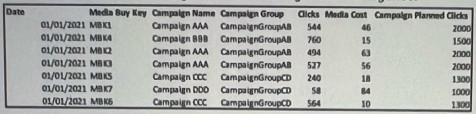
The mapping of the above file can be seen below:
Date — Day
Media Buy Key — Media Buy Key
Campaign Name — Campaign Name
Campaign Group -. Campaign Custom Attribute 01
Clicks —> Clicks
Media Cost —> Media Cost
Campaign Planned Clicks —> Delivery Custom Metric 01
The client would like to have a "Campaign Planned Clicks" measurement.
This measurement should return the "Campaign Planned Clicks" value per Campaign, for
example:
For Campaign Name 'Campaign AAA", the "Campaign Planned Clicks" should be 2000, rather than 6000 (the total sum by the number of Media Buy keys).
In order to create this measurement, the client considered multiple approaches. Please review the different approaches and answer the following question:
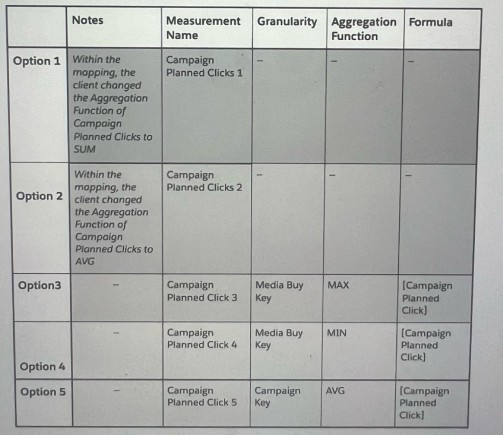
Which two options will yield a false result:
A. Option 2
B. Option 5
C. Option 3
D. Option 4
E. Option 1
Explanation: The goal is to obtain a "Campaign Planned Clicks" value per Campaign, not accumulated by Media Buy keys. Option 1 (SUM aggregation function) would sum all the "Campaign Planned Clicks" across Media Buy keys which would not yield the unique value per Campaign. Similarly, Option 5 (AVG aggregation function at Campaign Key level) would incorrectly average the values. Both options do not provide a way to return a singular "Campaign Planned Clicks" value for each Campaign.
| Page 1 out of 6 Pages |