Currently, the Done column of the Finance board shows all issues ever completed,
regardless of age. Now, the team wants to do a periodic clean-up of the Done column.
• They want to do the clean-up whenever it is needed on an ad-hoc basis.
• They want to be able to report on all the issues that were removed during each clean-up.
Which solution meets their need?
A. remove issues as needed using the Release link
B. exclude issues in Done status from the board filter
C. exclude issues in Done status via a sub-filter
D. exclude issues where Resolution != EMPTY from the board filter
Explanation: The team can use the Release link to remove issues as needed from the Done column. This will create a version in the project that contains all the issues that were removed, and the team can use the version report to see the details of each clean-up. Excluding issues in Done status from the board filter or via a sub-filter will not remove them from the Done column, but only hide them from view. Excluding issues where Resolution != EMPTY from the board filter will also hide issues from other columns that have a resolution set, which is not desired. References: [Releasing a version], [Managing Jira Projects Data Center and Server: Certification Bundle]
You are responsible for three software products with individual release cycles.
Each product is managed in a different project.
Which report can provide an instant progress overview of all fix versions across all
projects?
A. Release Burndown
B. Pie Chart Report
C. Version Workload Report
D. Version Report
E. Single Level Group By Report
Explanation: The report that can provide an instant progress overview of all fix versions across all projects is thePie Chart Report. This report allows you to create a pie chart
based on any statistic type, such as Fix Version, Project, Issue Type, etc. You can use this
report to compare the relative proportions of issues in different fix versions across different
projects. For example, you can create a pie chart based on the Fix Version statistic type,
and select all the projects that you are responsible for. This will show you how many issues
are assigned to each fix version in each project, and what percentage they represent of the
total issues. You can also filter the issues by status, priority, assignee, or any other criteria.
This report can help you monitor the progress of your releases and identify any potential
risks or delays.To generate a Pie Chart Report, follow these steps1:
Navigate to the project that you want to report on.
From the project sidebar, select Reports.
Select Pie Chart Report from the list of reports.
Select the statistic type that you want to base your pie chart on. In this case, select
Fix Version.
Select the projects that you want to include in your report. You can select multiple
projects by holding down the Ctrl key (Windows) or Command key (Mac) while
clicking on the project names.
Optionally, select a filter to narrow down the issues that you want to include in your
report. You can use an existing filter or create a new one.
Click View to generate the report.
You can also access the Pie Chart Report from your dashboard by adding the Jira Chart
gadget2. This gadget allows you to display any Jira report on your dashboard.To add the
Jira Chart gadget to your dashboard, follow these steps2:
Navigate to your dashboard and click Add gadget.
Search for Jira Chart and click Add gadget.
Configure the gadget settings as follows:
You can also edit or delete the gadget at any time by clicking on the menu icon at the top
right corner of the gadget.
Anu has access to the DEV project and its Scrum board.
She also needs to plan, start, and complete sprints, and to edit sprint goals and dates
Where must Anu be added onto?
A. the group that has Schedule Issues permission
B. the list of board administrators for the Scrum board
C. a project role that has Start/Complete Sprints permission
D. a project role that has Manage Sprints permission
E. a project role that has Administer Projects permission
Explanation: Anu needs to be added to a project role that has Manage Sprints permission.
This permission allows Anu to plan, start, and complete sprints, as well as edit sprint goals
and dates on a Scrum board. The other options are not correct for Anu’s needs. The group
that has Schedule Issues permission does not allow Anu to manage sprints, but only to
rank issues on a Scrum board. The list of board administrators for the Scrum board does
not grant Anu any permissions, but only allows Anu to configure the board settings. A
project role that has Start/Complete Sprints permission does not allow Anu to edit sprint
goals and dates, but only to start and complete sprints on a Scrum board. A project role
that has Administer Projects permission does not allow Anu to manage sprints, but only to
administer the project settings. For more information on how to manage sprints on a Scrum
board, see Manage sprints and Manage project permissions. References: Manage
sprints, Manage project permissions
You need to assign team members to view code commits in the DEV project. An excerpt of
the DEV permission scheme is shown.
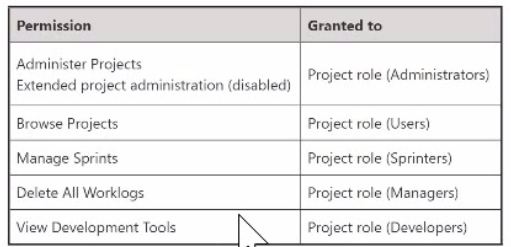
Which two project roles must they be granted? (Choose two.)
A. Users
B. Administrators
C. Developers
D. Sprinters
E. Managers
Which statement is true about Jira attachments?
A. Users can search for issues that contain attachments
B. Users need Work On Issues permission to remove attachments.
C. Users need Edit Issues permission to add attachments.
D. Project administrators can disable attachments through project settings.
Explanation: Jira attachments are files that users can attach to issues to share information with their team. Users can search for issues that contain attachments by using the attachments field in the advanced search. For example, attachments is not EMPTY will return all issues that have at least one attachment. Therefore, option A is true.
Your team works in a project that uses only one workflow, a simplified workflow.
The configuration of the corresponding Kanban board is shown:
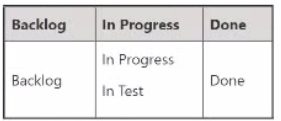
Which statement is definitely true?
A. Bugs can be dragged from "In Progress" to "In Test" on this board.
B. All team members can transition issues from Backlog to In Test.
C. Issues can be transitioned freely between all workflow statuses
D. A resolution will be set once an issue is dragged to Done
Explanation: The statement that is definitely true is that bugs can be dragged from “In Progress” to “In Test” on this board. This is because the board configuration shown in the image has two columns: “In Progress” and “Done”. The “In Progress” column has three statuses mapped to it: “To Do”, “InProgress”, and “In Test”. The “Done” column has one status mapped to it: “Done”. Therefore, issues can be moved from one status to another within the same column by dragging them on the board. However, issues cannot be moved from one column to another by dragging them on the board, as this would require a workflow transition that is not available in a simplified workflow. A simplified workflow is a default workflow that allows any user with the Edit Issues permission to add or remove statuses on the fly. To move an issue from one column to another, you need to use the workflow button on the issue detail view and select a transition that matches the status of the destination column. References: Configuring columns, Using a simplified workflow
Your team often accepts new requests from outside groups during an active sprint. You want to see if such frequent scope change mid-sprint is causing bottlenecks. Which report provides the needed insight?
A. Control Chart
B. Burndown Chart
C. Average Age Chart
D. Velocity Chart
E. Cumulative Flow Diagram
Explanation: The Cumulative Flow Diagram is the report that provides the needed insight to see if frequent scope change mid-sprint is causing bottlenecks. The Cumulative Flow Diagram shows the quantity and distribution of work items along different stages of a process over time. The report can help identify potential bottlenecks in the workflow by showing where work items accumulate or stagnate over time. For example, if the report shows a sudden increase or a wide band of work items in the “In Progress” stage, it may indicate that the team is overloaded with work or facing some blockers. If the team often accepts new requests from outside groups during an active sprint, the report can show how this affects the flow of work and the completion of the sprint goal.
You want to update a workflow that is not shared.
You are a project administrator and "Extended project administration" is enabled.
Which two actions can you complete? (Choose two.)
A. Add a field to a transition screen.
B. Add a condition to limit who can approve issues,
C. Add new transitions to the workflow.
D. Delete transitions from the workflow.
E. Delete the Review status from Jira
A Scrum team working on multiple epics complains that they are constantly being pushed to complete more work than they think can be completed. Apparently, the product owner has constantly overloaded each of the past 8 sprints. Which single report can instantly prove their statement?
A. Velocity Chart
B. Cumulative Flow Diagram
C. Sprint Report
D. Control Chart
E. Epic Burndown
You are viewing a board that displays stories across multiple projects. You want to see a grouping of stories without epics. Which swimlane selection will achieve this?
A. Query: epic is EMPTY
B. Stories
C. Query: Type = Epic
D. Projects
E. Epics
Explanation: Swimlanes are a way of grouping issues on a board based on certain criteria, such as assignee, priority, query, or epics. If you want to see a grouping of stories without epics, you can use a query swimlane with the condition epic is EMPTY, which will show only issues that are not part of any epic. The other options will either show epics or not group stories at all. Therefore, the correct answer is A.
The head of customer service wants to identity potential bottlenecks in the support workflow of her teams in the last three months. Which report provides this information?
A. Created vs. Resolved Issues Report
B. Time Since Issues Report
C. Cumulative Flow Diagram
D. Resolution Time Report
E. Average Age Report
Explanation: The Cumulative Flow Diagram is the report that provides the information that the head of customer service wants. The Cumulative Flow Diagram is a tool that visualizes the quantity and distribution of work items along different stages of a process. The report shows how many work items are in each stage at any given time, and how they flow from one stage to another. The report can help identify potential bottlenecks in the support workflow by showing where work items accumulate or stagnate over time. For example, if the report shows a sudden increase or a wide band of work items in the “Waiting for Customer” stage, it may indicate that the customers are not responding quickly enough or that the support team is not following up effectively. The report can also help monitor the overall progress and performance of the support teams by showing the total number of work items created, resolved, and remaining over time.
Paul and Tessa are in the Auditors role of every project.
You need to write a JQL query that shows Issues reported by either of them that are still
unassigned.
Select the correct JQL query.
A. Reporter IN (Paul, Tessa) AND Assignee IS EMPTY
B. Reporter IN (Auditors) AND assignee - EMPTY
C. Reporter IN members OfC Auditors") AND assignee = NULL
D. Reporter IS Paul OR Reporter IS Tessa AND Assignee IS NULL
E. (Reporter - Paul OR Reporter – Tessa) AND Assignee - Unassigned
Explanation: The correct JQL query to find issues reported by either Paul or Tessa that are still unassigned is: Reporter IN (Paul, Tessa) AND Assignee IS EMPTY. This query uses the IN operator to specify a list of values for the Reporter field, and the IS EMPTY operator to check if the Assignee field has no value. The other options are incorrect because they use invalid syntax or operators, such as “-”, NULL, or Unassigned. For more information on JQL syntax and operators, see JQL operators and Use advanced search with Jira Query Language (JQL). References: JQL operators, Use advanced search with Jira Query Language (JQL)
| Page 1 out of 7 Pages |